Table of contents
Same BatchBacktesting[1] engine as the earlier indicator experiment, but emphasized at portfolio scale: many tickers, two strategies, equities plus crypto, aggregate winners and losers.
1. Why run many tickers at once
Single-ticker backtests flatter you. A grid run answers:
- Does this rule only work on one heroic symbol?
- Are disasters clustered in a sector or era?
- Is crypto dominating the leaderboard because volatility is unbounded in the sim?
2. Architecture (same as BatchBacktesting)
| Layer | Role |
|---|---|
| Data adapters | FMP + Binance fetch |
| Strategy objects | EMA, MACD parameter sets |
| Runner | Thread pool, CSV output, optional plots |
output/ | Per-run artifacts — not committed to GitHub by default |
Pre-calculated results are not in the upstream repo (too user-specific). You generate locally, then inspect output/charts/....
3. The two strategies
Both strategies use backtesting.py[2] with indicators from pandas_ta.
EMA crossover. Buy when the 20-period EMA crosses above the 80-period EMA, sell on the opposite cross. Each entry carries a 10 % stop loss and a 25 % take profit.
class EMA(Strategy):
    n1 = 20
    n2 = 80

    def init(self):
        close = self.data.Close
        self.ema20 = self.I(taPanda.ema, close.s, self.n1)
        self.ema80 = self.I(taPanda.ema, close.s, self.n2)

    def next(self):
        price = self.data.Close
        if crossover(self.ema20, self.ema80):
            self.position.close()
            self.buy(sl=0.90 * price, tp=1.25 * price)
        elif crossover(self.ema80, self.ema20):
            self.position.close()
            self.sell(sl=1.10 * price, tp=0.75 * price)
MACD crossover. The MACD line is the 12-period EMA minus the 26-period EMA; the signal line is a 9-period EMA of that difference. Buy when MACD crosses above its signal line, sell on the opposite cross. No stop loss or take profit here.
class MACD(Strategy):
    short_period = 12
    long_period = 26
    signal_period = 9

    def init(self):
        close = self.data.Close
        self.macd = self.I(taPanda.macd, close.s, self.short_period, self.long_period, self.signal_period)

    def next(self):
        macd_line = self.macd.macd
        signal_line = self.macd.signal
        if crossover(macd_line, signal_line):
            self.position.close()
            self.buy()
        elif crossover(signal_line, macd_line):
            self.position.close()
            self.sell()
4. Running at scale
tickers = get_SP500()
run_backtests(tickers, strategy=EMA, num_threads=12, generate_plots=True)
run_backtests(tickers, strategy=MACD, num_threads=12, generate_plots=True)

tickers = get_all_crypto()
run_backtests(tickers, strategy=EMA, num_threads=12, generate_plots=True)
run_backtests(tickers, strategy=MACD, num_threads=12, generate_plots=True)
Each call fans out over a thread pool. Tune num_threads to your machine and to the API rate limits of Financial Modeling Prep and Binance.
5. EMA leaderboard
Top five returns for the EMA strategy:
| Instrument | Return |
|---|---|
| BTCBUSD | 293.78 % |
| ALB | 205.97 % |
| OMGUSD | 199.62 % |
| BBWI | 196.82 % |
| GRMN | 193.47 % |
Bottom five:
| Instrument | Return |
|---|---|
| BTTBUSD | −99.93 % |
| UAL | −82.63 % |
| NCLH | −81.51 % |
| LNC | −78.02 % |
| CHRW | −76.38 % |
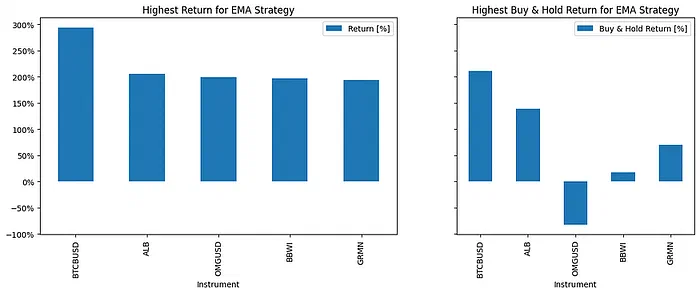
The right-hand chart is the useful one. OMGUSD returned about 200 % with the EMA rule while buy-and-hold lost about 80 %, so the rule made money by being short through a collapse. BTCBUSD and ALB went up under both, which says more about the period than about the rule.
High returns often mix long bullish windows on volatile crypto pairs, lucky signals in sideways stocks, and parameters that happen to fit one period. Deep negatives flag illiquid symbols the simulation still trades, trend rules in collapsing sectors (airlines and cruise lines above), and broken or delisted pairs treated like normal tickers.
Before saying “MACD beats EMA”, compare the median return across all tickers, not only the top five.
6. Honest limitations
- Not financial advice.
- Fees, borrow, halts, and corporate actions are only as good as the data feed + library defaults.
- Past batch output ≠ future edge.
7. Takeaway
Use multi-ticker backtests as smoke tests for rules — find where they break, not where to deploy capital.
8. Related posts
Originally published on Medium[3]. Full code listings: BatchBacktesting[1].