Skip to content
← All articles
Article

Teaching Python through an end-to-end data workshop

Listen to the audio story

From a Python install to an Apple stock chart · 2:21 · AI-written script, synthetic voices

Transcript

Ava: Here's a test for any beginner workshop. Every new idea should have somewhere to go. If it doesn't, people forget it by the next slide.

Andrew: That sounds like most tutorials I've sat through. Lots of concepts, no destination.

Ava: Right. So Antoine wrote about AlgoETS Workshop one, a teaching repository that does the opposite. It starts with Python setup, moves to an API response, then a data frame, then a chart. Everything feeds the next step.

Andrew: How big is it?

Ava: Nine Jupyter notebooks in six numbered folders. Two for setup, two for Python, one for APIs, one for pandas, two for visualization, and a final project. Antoine is careful to say that's a count of teaching material, not a number of students who finished.

Andrew: Fair. And setup is usually where beginners give up, isn't it?

Ava: It is, so the repo offers a Colab link and a local Jupyter install. People can start writing code right away, and treat environment setup as its own topic later. The numbered folders also mean you can go back to one missing concept without redoing the whole project.

Andrew: What's the payoff at the end?

Ava: The final notebook plots Apple closing prices with exponential moving averages. Twelve, twenty-six, fifty, a hundred and two hundred days. It ties together the request, the table, the indicator columns and a labeled chart.

Andrew: So is this a trading strategy?

Ava: No, and the post says so plainly. It doesn't show that any crossover makes money. It's a data exercise.

Andrew: What would you ask a class looking at that chart?

Ava: Technical things. Are the dates in order? Were missing values removed on purpose? Why does a longer average react more slowly? Are all the curves computed from the same observations?

Andrew: Any warning before someone tries it?

Ava: Yes. APIs, keys and package versions may have changed since the original workshop. Treat the notebooks as material to read and adapt, not a one-command setup.

Andrew: And where does it lead next?

Ava: To Antoine's batch backtesting engine. Same indicator idea, tested across many instruments with recorded assumptions. The point is understanding data and code before trusting any leaderboard. The full post has the flow diagram and the links to each notebook.

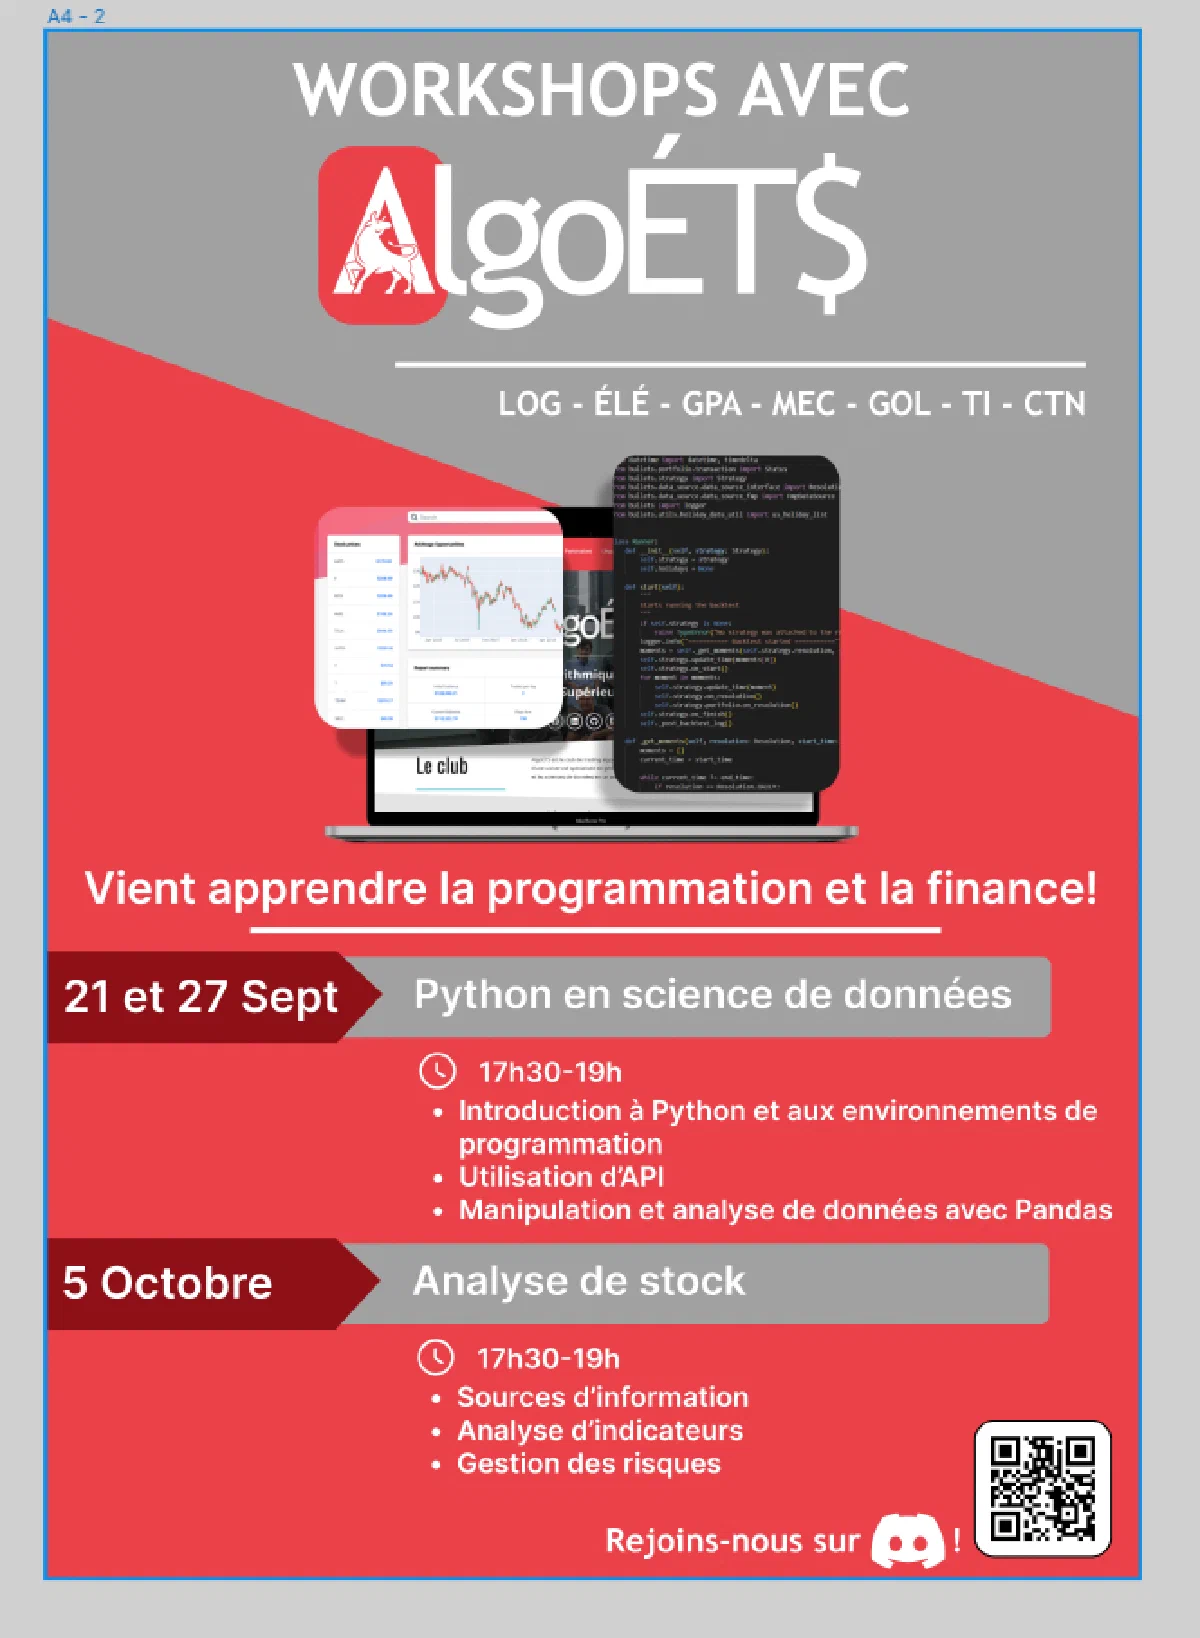
AlgoETS artwork used in the workshop repository
Table of contents

The most useful beginner workshop gives each new concept somewhere to go. AlgoETS/Workshop1 moves from Python setup to an API response, a DataFrame, and a chart. The final notebook uses Apple price data and exponential moving averages to bring those steps together.

1. Nine notebooks, six stages

The repository contains nine Jupyter notebooks across six numbered directories: two setup notebooks, two Python notebooks, one API notebook, one pandas notebook, two visualization notebooks, and one final project.

This is a count of checked-in teaching material, not a student attendance or completion statistic.

flowchart TD
  S["Environment and cloud notebooks"] --> P["Python basics and advanced concepts"]
  P --> A["Read API responses"]
  A --> D["Clean and explore with pandas"]
  D --> V["Visualize the data"]
  V --> E["Apple prices and EMA project"]

2. Keep setup from swallowing the lesson

The README links a Colab entry point[1]. Local Jupyter is also documented. Offering both lets learners begin with code while keeping environment setup available as its own topic.

The six-stage structure makes it possible to return to a missing concept without restarting the entire project.

3. The final exercise is concrete

The code in 5.1_project_ema.ipynb[2] plots Apple closing prices with 12-, 26-, 50-, 100-, and 200-day EMA curves. This is a more precise description than the README’s broad “advanced exploration and modeling” language.

The exercise connects a request, tabular data, indicator columns, and a labeled chart. It does not establish that any crossover makes money.

4. Read the chart as a data exercise

Useful classroom questions are technical: are dates ordered correctly? Were missing values removed intentionally? Why does a longer EMA respond more slowly? Are all curves computed from the same observations?

API availability, keys, and package versions can change since the original workshop. The notebooks are teaching material to inspect and adapt, not a promise of a fresh one-command environment.

5. From one chart to a batch experiment

The natural continuation is BatchBacktesting: the same indicator idea, now evaluated across instruments with recorded assumptions and comparable outputs.

That progression keeps the focus on understanding data and code before interpreting a leaderboard.

6. Sources

References

  1. Colab entry point. (). [Web page] colab.research.google.com.
  2. AlgoETS. (). 5.1_project_ema.ipynb. [Source file or documentation] github.com.
  3. AlgoETS. (). Workshop1. [Software repository] github.com.
  4. AlgoETS. (). Python basics notebook. [Source file or documentation] github.com.

References use this article’s publication date.